
Latest IELTS Writing Task 1 2022 (Graphs, Charts, Maps, Processes)
Evening Slot Writing Task 1, 24th September 2022, India
Sample Answer
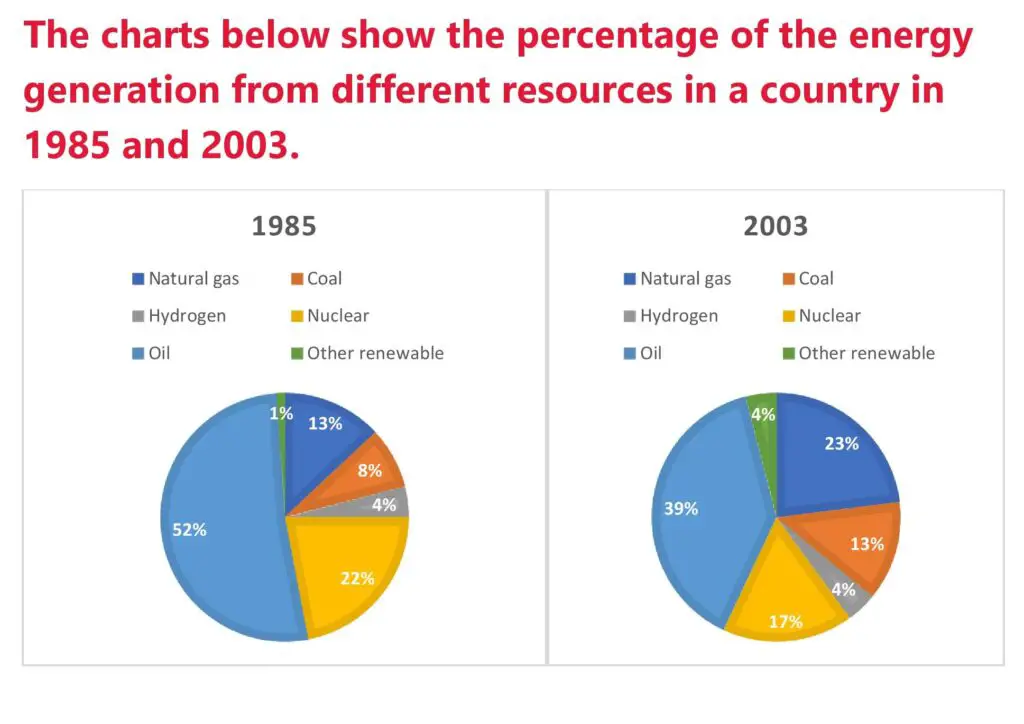
The circle charts depict the power generation ratio from a nation’s divergent resources in 1985 and 2003.
Overall, it is readily apparent that the highest energy production was from oil in both years, and the lowest was from other renewables. In contrast, the share of natural gas, coal and other renewables elevated, and the contribution of nuclear and oil plummeted in the given period.
Turning to the details, the contribution of oil to total energy production was 52 per cent in 1985, which dropped to 39 per cent in 2003. Moving further, 13 % of energy came from natural gas in 1985, which surged to 23 per cent in 2003. Furthermore, the share of coal was 8% in 1985, which inclined to 13% in 2003. In addition, the contribution of hydrogen remained the same in both years at 4 per cent. Moreover, the share of nuclear in total energy generation was 22 per cent in 1985, which nosedived to 17 per cent in 2003. Lastly, the share of other renewables climbed to 4 per cent in 2003 from 1 per cent in 1985.
Evening Slot Writing Task 1, 15th September 2022, India
Table Chart
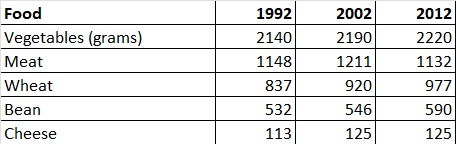
The table below presents the food consumption per person weekly in a European country in 1992,2002, and 2012.
Sample Answer
The table chart depicts the food consumption per person per week in a European nation in 1992,2002, and 2012.
Overall, it is evident that the consumption per person per week was highest for vegetables and lowest for cheese in the given period.
According to the table chart, the per capita consumption per week of vegetables was 2140 grams in 1992, which inclined to 2190 grams in 2002 and 2220 gms in 2012. The meat consumption was 1148 grams in 1992, and it saw a slight increase in 2002 and reached 1211grams, whereas it declined to 1132gms in 2012. Moreover, wheat’s consumption surged to 920 grams in 2002 from 837 in 1992 to 977grams in 2012. Furthermore, bean consumption inclined consistently in the given period from 532 grams in 1992 to 546grams in 2002, reaching 590 grams in 2012. Lastly, cheese consumption was 113 grams in 1992, which elevated to 125 grams in 2002 and remained stable in 2012.